
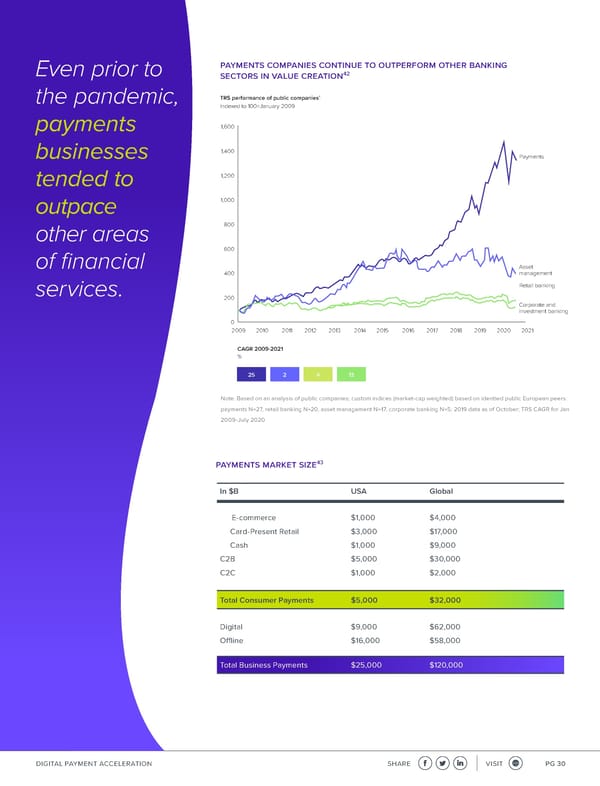
payments companies continue to outperform other banking Even prior to sectors in value creation42 1 the pandemic, TRS performance of public companies Indexed to 100=January 2009 payments 1,600 businesses 1,400 Payments tended to 1,200 outpace 1,000 other areas 800 600 of 昀椀nancial Asset 400 management services. Retail banking 200 Corporate and investment banking 0 2009 2010 2011 2012 2013 2014 2015 2016 2017 2018 2019 2020 2021 CAGR 2009-2021 % 25 2 4 13 Note: Based on an analysis of public companies; custom indices (market-cap weighted) based on identied public European peers: payments N=27, retail banking N=20, asset management N=17, corporate banking N=5; 2019 data as of October; TRS CAGR for Jan 2009-July 2020 payments market size43 In $B USA Global E-commerce $1,000 $4,000 Card-Present Retail $3,000 $17,000 Cash $1,000 $9,000 C2B $5,000 $30,000 C2C $1,000 $2,000 Total Consumer Payments $5,000 $32,000 Digital $9,000 $62,000 O昀툀ine $16,000 $58,000 Total Business Payments $25,000 $120,000 DIGITAL PAYMENT ACCELERATION SHARE VISIT PG 30
 Immersive Experience | Fintech Revolution Page 29 Page 31