
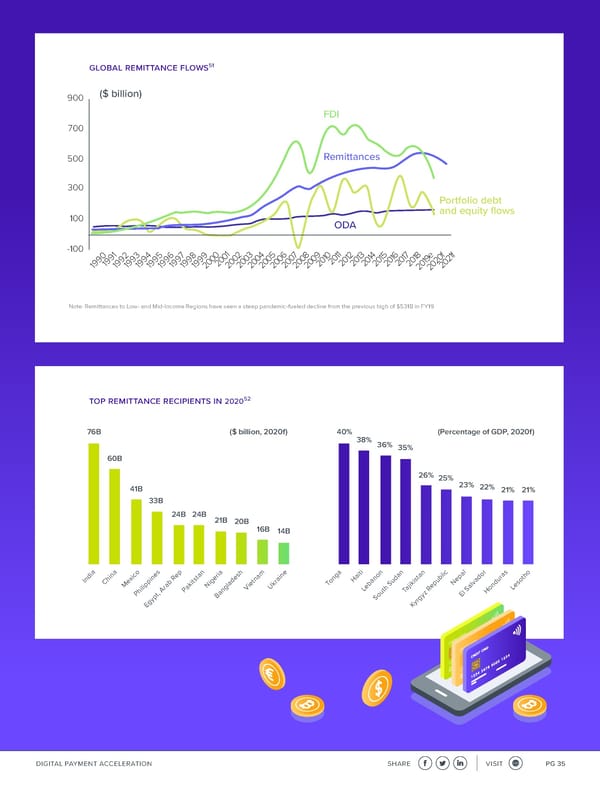
global remittance flows51 900 ($ billion) FDI 700 500 Remittances 300 Portfolio debt 100 and equity flows ODA -100 1 1 f f 0 2 3 4 5 6 7 8 9 0 1 2 3 4 5 6 7 8 e 1 0 0 0 0 0 0 0 0 0 0 1 0 1 1 1 1 1 1 1 9 0 2 0 0 0 0 0 0 0 0 0 0 0 2 0 0 0 0 0 0 0 1 2 0 1991 1994 1997 2 2 2 2 2 2 2 2 2 0 0 1993 1998 2 2 1992 1995 1990 1996 1999 2 2 2 2 2 2 2 2 2 2 Note: Remittances to Low- and Mid-Income Regions have seen a steep pandemic-fueled decline from the previous high of $531B in FY19 top remittance recipients in 202052 76B ($ billion, 2020f) 40% 38% (Percentage of GDP, 2020f) 36% 35% 60B 26% 25% 41B 23% 22% 21% 21% 33B 24B 24B 21B 20B 16B 14B a o s p a a ti n c r s o ia m i i o d ic e tan ri sh ine g an tan bl d a h In ine R ts de tna ra n Ha ud is u epal a ex p i ge o dur sot Chin b i ie k T S p N lv n e M a ak N gla V U ebano h ajik e a o L hilip Ar P L t T R S H P t, an z l B Sou gy E gyp yr E K DIGITAL PAYMENT ACCELERATION SHARE VISIT PG 35
 Immersive Experience | Fintech Revolution Page 34 Page 36