

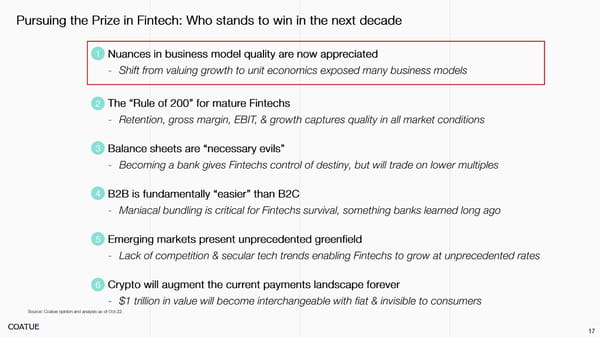
Fintech and the Pursuit of the Prize
Whitepaper | Who Stands to Win Over the Next Decade?


Total 2000 2005 2010 2015 2020
Square Adyen Coinbase nCino Clover Health Metromile
• • • • • •
Bill.com Bill.com Lightspeed p Lightspeed p aC a C t) e et) ’21 rk ’21 rk av a v o M o Square n iN- n M-N Square i ’20 ’20 r ar a M M hange( C Change( % % Adyen Adyen Q2 PagSeguro Coupa PagSeguro Q2 Coupa StoneCo StoneCo ’21A Op Margin + Retention ’21A Rev Growth
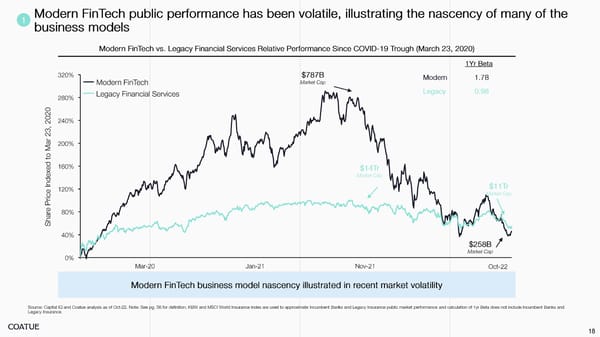
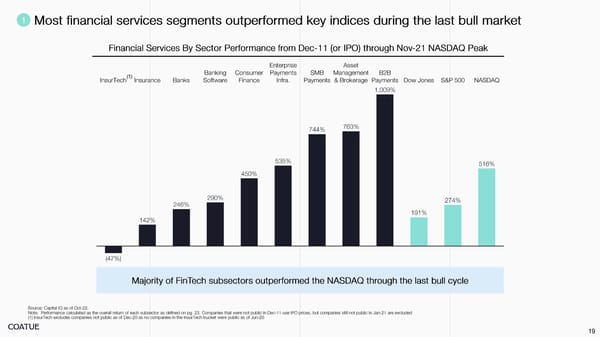
Banking Insurance Software NASDAQ S&P 500 Dow Jones
Toast StoneCo StoneCo Flywire nCino Flywire Toast pa Adyen p nCino C PagSeguro Ca t ) PagSeguro e dlocal ) Adyen ’22 rk ’22 dlocal a g Lightspeed Marqeta arketg u Marqeta M M u A n i- Coupa Bill.com in -A Lightspeed ’22 e ’22 r Coupa g r ngea Bill.com a M Duck Creek Technologies M ha( C Q2 Chan( Q2 % % Duck Creek Technologies Affirm Square Square Affirm ’22E Op Margin + Retention ’22E Rev Growth
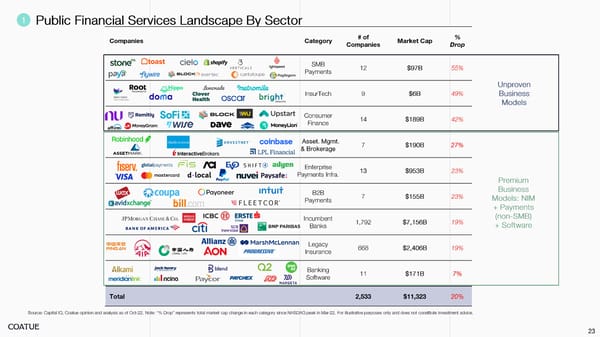
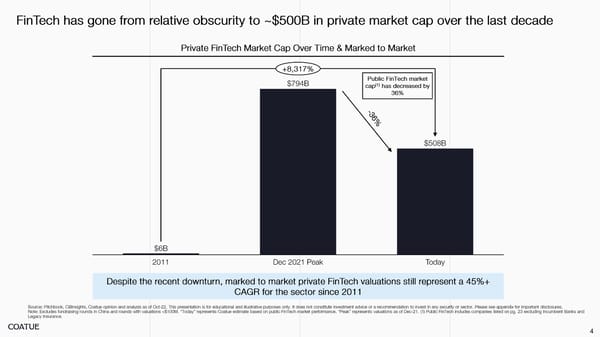
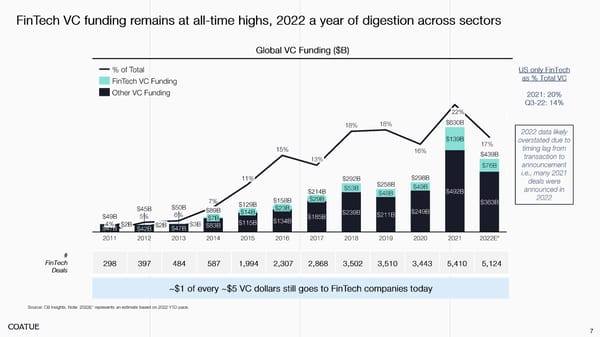
-39% $2,398B -71% $1,002B $38B $1,453B $154B $291B $6B $168B Peak Today Peak Today
• • • • • •
• •
$6,306 29.6x 157% 48% 37% 52% 294% $14,487 20.3x 131% 84% 2% 38% 255% $3,825 14.6x 155% 65% (4%) 26% 242% $13,705 4.5x 140% 44% 34% 18% 236% $19,529 6.9x 125% 79% 12% 20% 236% $13,675 7.1x 93% 79% 54% 9% 235% $4,770 3.1x 115% 57% 33% 21% 227% $4,018 7.5x 175% 44% (22%) 29% 225% $2,607 17.1x 123% 67% 2% 31% 223% $40,043 30.6x 155% 15% 9% 41% 219% $3,295 2.7x 99% 60% 38% 19% 216% $1,375 9.3x 120% 64% 21% 9% 214% $4,605 9.6x 110% 73% 7% 19% 209% $1,878 7.7x 119% 52% 4% 18% 193% $1,403 10.9x 117% 58% (11%) 26% 190% $810 6.2x 100% 51% 25% 11% 188% $1,590 7.3x 10⁸% 59% 5% 12% 183% $8,580 15.0x 135% 19% (5%) 32% 181% $96,451 14.2x 92% 42% 24% 7% 166% $1,754 3.5x 90% 60% (13%) 28% 165% $2,724 6.2x 100% 45% (22%) 34% 157% $533 3.5x 145% 43% (60%) 1% 129% $153 0.6x 70% 56% (50%) 26% 102% $5,495 41.2x 100% 18% (52%) 30% 96% $1,529 29.4x 93% 23% (141%) 60% 35% $370 1.3x 87% 31% (217%) 96% (3%)
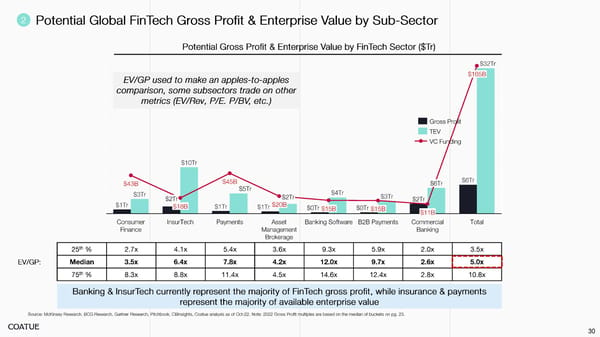
▪ Enterprise Payments and Payments Infrastructure ▪ Banking Software 37.9x 9.3x 200%+ ▪ B2B Payments ▪ Asset Management & Brokerage ▪ SMB Payments ▪ Consumer Finance ▪ InsurTech 27.4 7.3x
40.0x 15x 11x 11x 20.0x Oct-20 Jan-21 Apr-21 Jul-21 Oct-21 Jan-22 Apr-22 Jul-22
$317 $126 4% 26% 9.0x $1,795 $207 12% 34% 23.6x $250 $94 5% 28% 8.9x $170 $46 11% 29% 12.4x $158 $73 (7%) 21% 8.5x $148 $31 17% 15% 28.3x $82 $75 5% 19% 6.3x $110 $60 4% 14% 12.4x $62 $24 7% 26% 9.0x $97 $30 (6%) 19% 16.1x
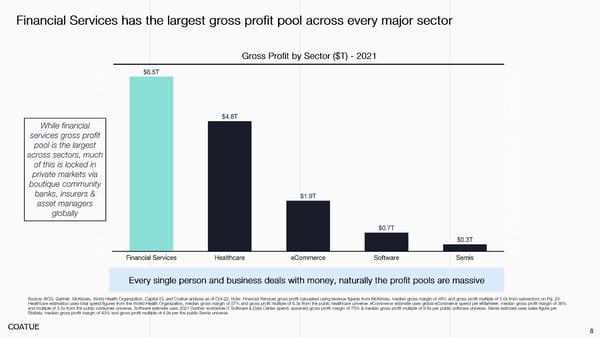
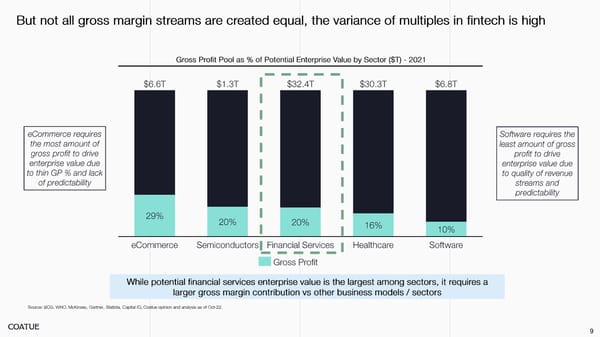
Gross Profit Market Cap Semis eCommerce Software Healthcare Financial Services
• • • • • •
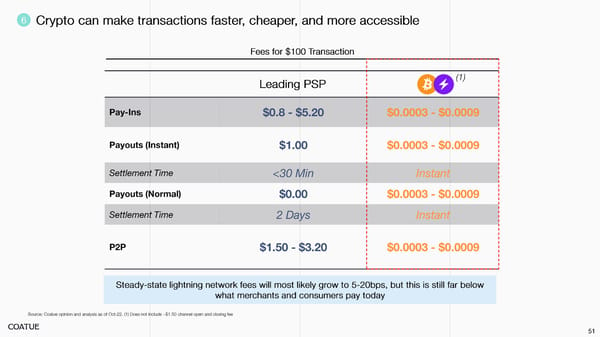
15bps 10bps 15bps Gross Processing Funding Losses Net Revenue Gross Processing Funding Losses Net Revenue Revenue Costs Costs (Debt Revenue Costs (At Costs (Fed Investor) Cost) Funds Rate) Gross Profit Book Value High Low
Gross Profit Multiples Book Value Multiples High Low
$3.0B $2.5B $2.0B $1.5B $1.0B $0.5B $0.0B 2014 2017 2020 2023 2014 2017 2020 2023
• • • • • •
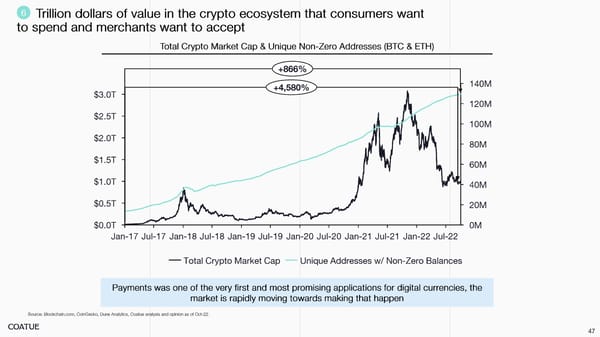
Jan-17 Jul-17 Jan-18 Jul-18 Jan-19 Jul-19 Jan-20 Jul-20 Jan-21 Jul-21 Jan-22 Jul-22
• 200% 150% 100%
• • • • • •
2016 2017 2018 2019 2020 2021 Internet Penetration Smartphone Penetration +3,179% Brazil Chile Argentina Colombia Peru Mexico Nov-20 Mar-21 Jun-21 Sep-21 Dec-21 Mar-22 Jun-22 Aug-22 2017 2021
Incumbents New Entrants → → $308B → $271B $268B $221B $242B → $196B $206B → $68B $100B $30B $46B → $1B $8B $17B 2015 2016 2017 2018 2019 2020 2021
• • • • • •
Apr-22 May-22 Jun-22 Jul-22 Aug-22 Sep-22
• • • • • •

ACI Interactive Brokers ADP Intuit Jack Henry AssetMark LPL C. Schwab MasterCard Cantaloupe MeridianLink MoneyGram Paychex Cielo Paycor Euronet PayPal Evertec PaySafe EVO FIS Fiserv FleetCor Visa Global Payments Green Dot Western Union WEX
This presentation is confidential and not intended for public use or further distribution without the prior written consent of Coatue Management, L.L.C. The information herein is provided for illustrative purposes only, reflects the opinions of Coatue or its Coatue Analysis advisors, and does not constitute investment advice or a recommendation to buy or sell any securities. Unless otherwise indicated, all figures and calculations are for informational purposes only, computed by Coatue or its advisors and not audited by any third party or approved by any governmental agency. Although Coatue believes that the data expressed in this presentation is accurate and reasonable, actual results could differ materially from those projected or assumed, and such projections are subject to change, and are subject to inherent risks and uncertainties. Neither Coatue nor its affiliates or advisors guarantees the accuracy or completeness of the information. Accordingly, neither Coatue nor any of its affiliates, advisors or employees shall be liable to you or anyone else for any loss or damages from use of the information contained in this presentation. Unless otherwise indicated, companies referenced herein are for illustrative purposes only, and such companies do not necessarily represent investments that any Coatue fund owns or may own in the future. Coatuefunds may or may not hold positions in certain of the companies mentioned in this whitepaper. Forward-looking This presentation contains forecasts, projections and other forward-looking statements, including (but not Statements limited to) the occurrence or outcome of anticipated events, estimates, price targets, valuation, exposure limits and performance returns There is no guarantee that such forecasts, projections or forward-looking statements will be realized and therefore investors should not rely on such statements in making an investment decision